What if the best time to act on a Miami Beach luxury condo is not about guessing the next headline, but understanding how this market has moved for years? If you are weighing a purchase or sale on the Venetian Islands or in South Beach, you want context you can trust. In this guide, you will learn how past condo cycles unfolded, which metrics matter, and how seasonality and small-sample dynamics affect your timing. Let’s dive in.
Miami luxury cycles at a glance
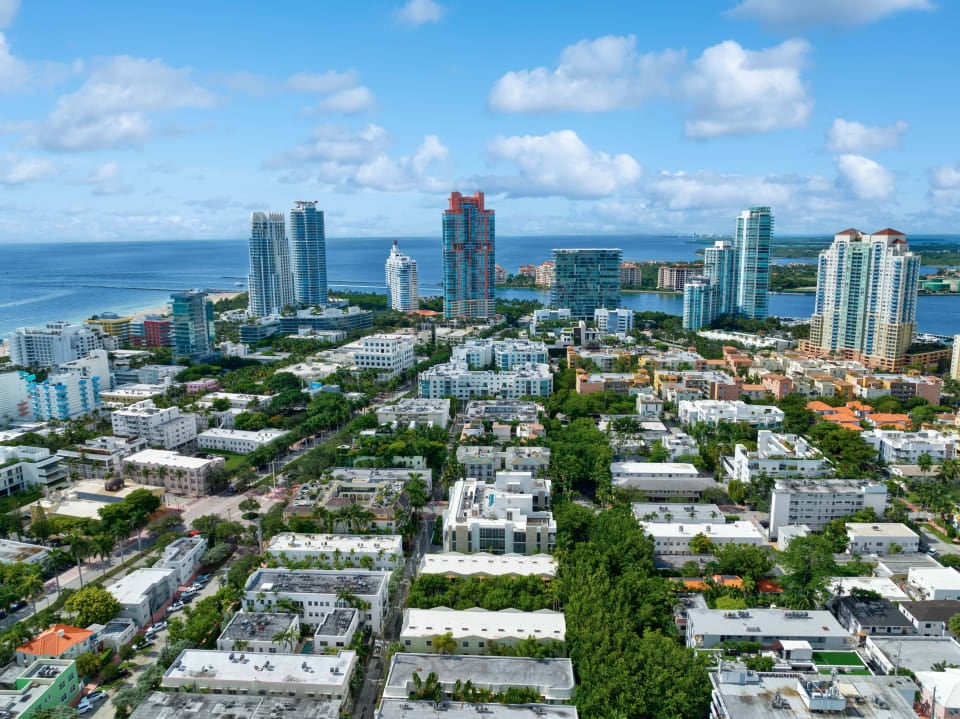
Miami’s luxury condo market moves in recognizable waves. New construction, interest rates, and international capital all play roles. The Venetian Islands and South Beach ride the same tides, but each responds in its own way.
2000s boom and downturn
The mid-2000s saw a surge in Miami condo building powered by speculation and international demand. The 2007 to 2010 housing bust and global liquidity freeze hit hard, pushing prices down and delaying projects. The lesson is simple. Heavy leverage and a wave of completions amplify both upside and downside.
2012 to 2016 recovery
As financing stabilized, buyers from Latin America and Europe re-engaged, and rates stayed low. Luxury waterfront and South Beach niches recovered early. Limited immediate post-crisis completions helped speed absorption. Desirable micro-markets led the rebound.
2016 to 2021 expansion
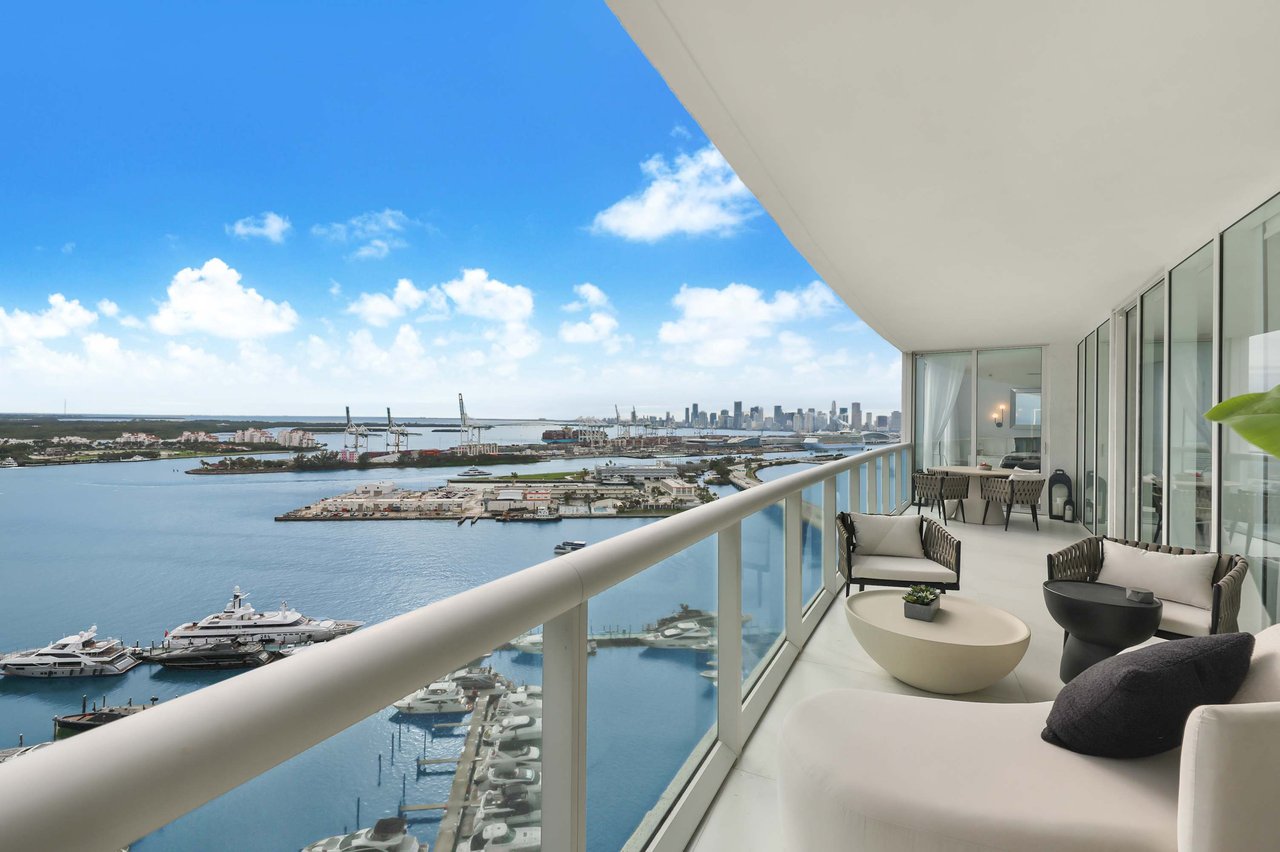
Waterfront islands and trophy buildings kept appreciating. All-cash activity grew, helping speed closings and support pricing. In 2020, the pandemic first paused activity, then unleashed strong demand from out-of-state buyers seeking Florida lifestyle and tax advantages. Inventory tightened and prices rose in top locations.
2022 to mid-2024 cooling
Rising mortgage rates cooled many segments. Ultra-prime condos still found buyers, often with longer marketing times. Price adjustments and higher months of inventory appeared in several luxury price bands. Reading rolling trends became more important than single-month spikes.
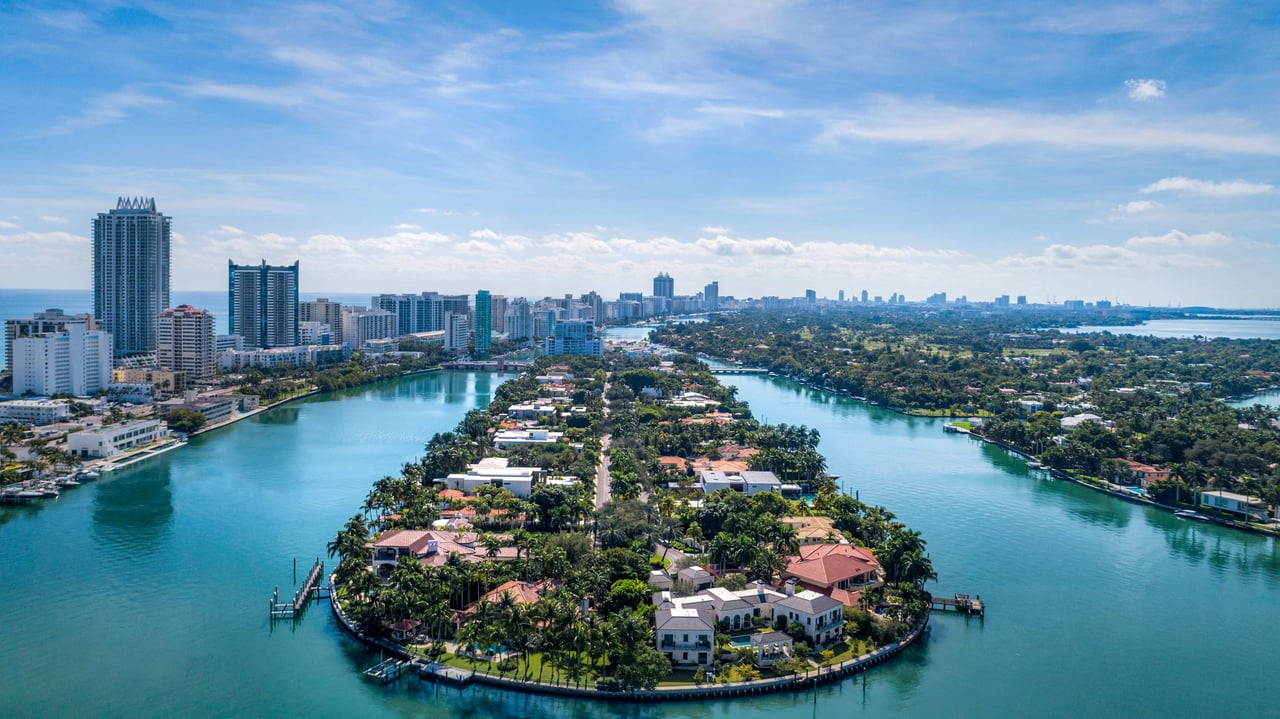
Venetian Islands vs South Beach
These neighbors sit side by side, yet their signals can look different. The reason is the product mix and sample size.
Venetian Islands signals
The Venetian Islands are known for high-value waterfront single-family homes and townhomes. Condo inventory exists but is limited. That means volume-based metrics can swing quickly. A single sale or listing can move the stats. You should smooth results with 6 to 12 month rolling views and compare to nearby higher-volume areas.
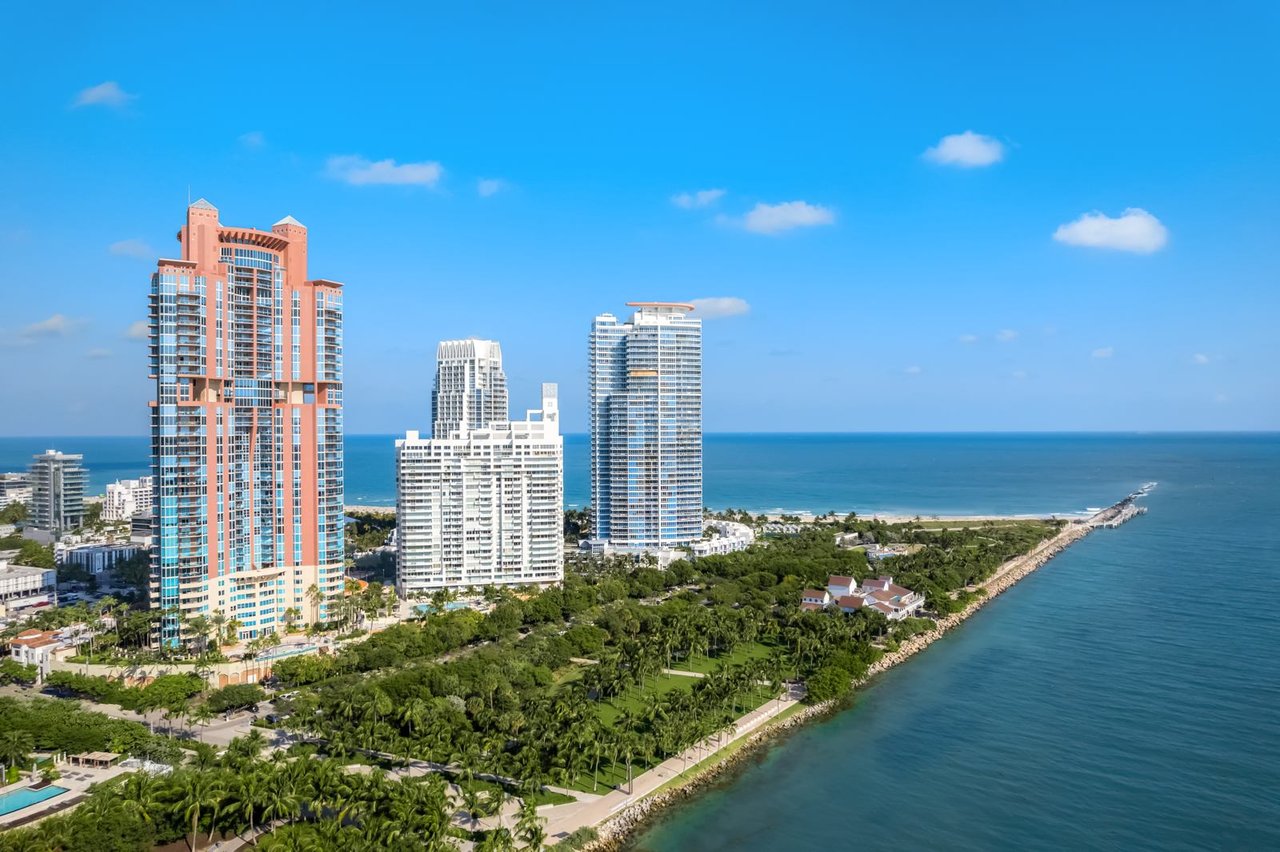
South Beach signals
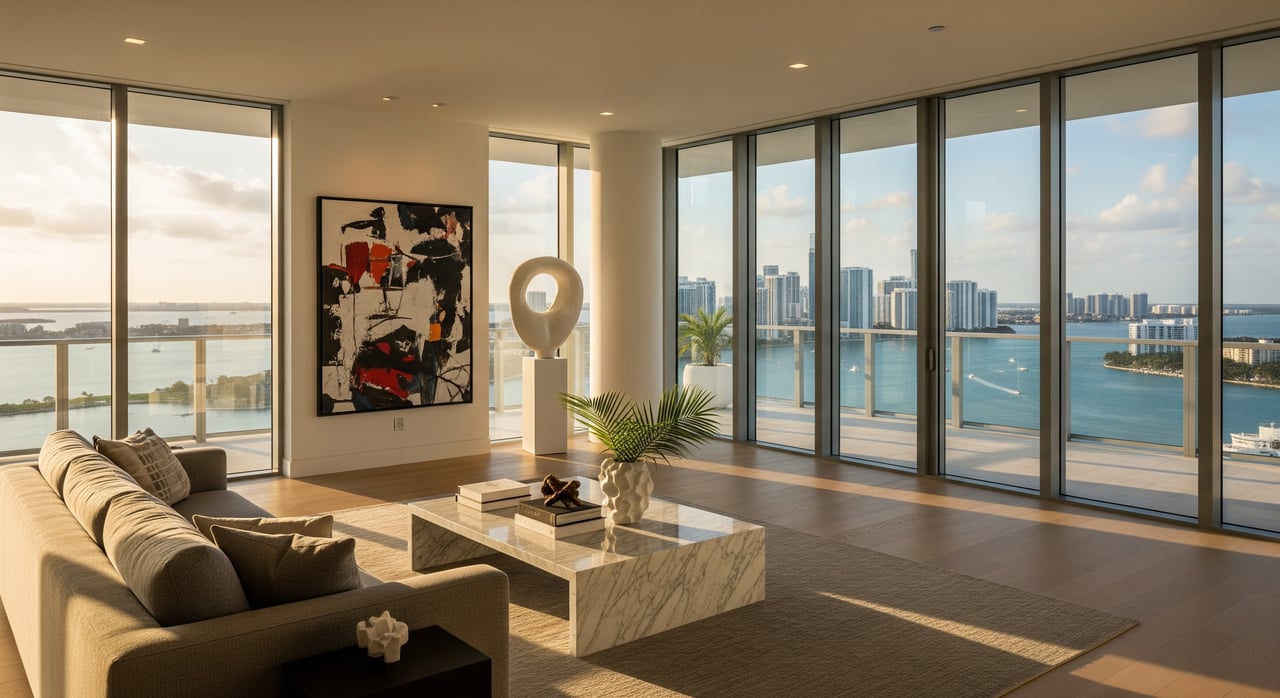
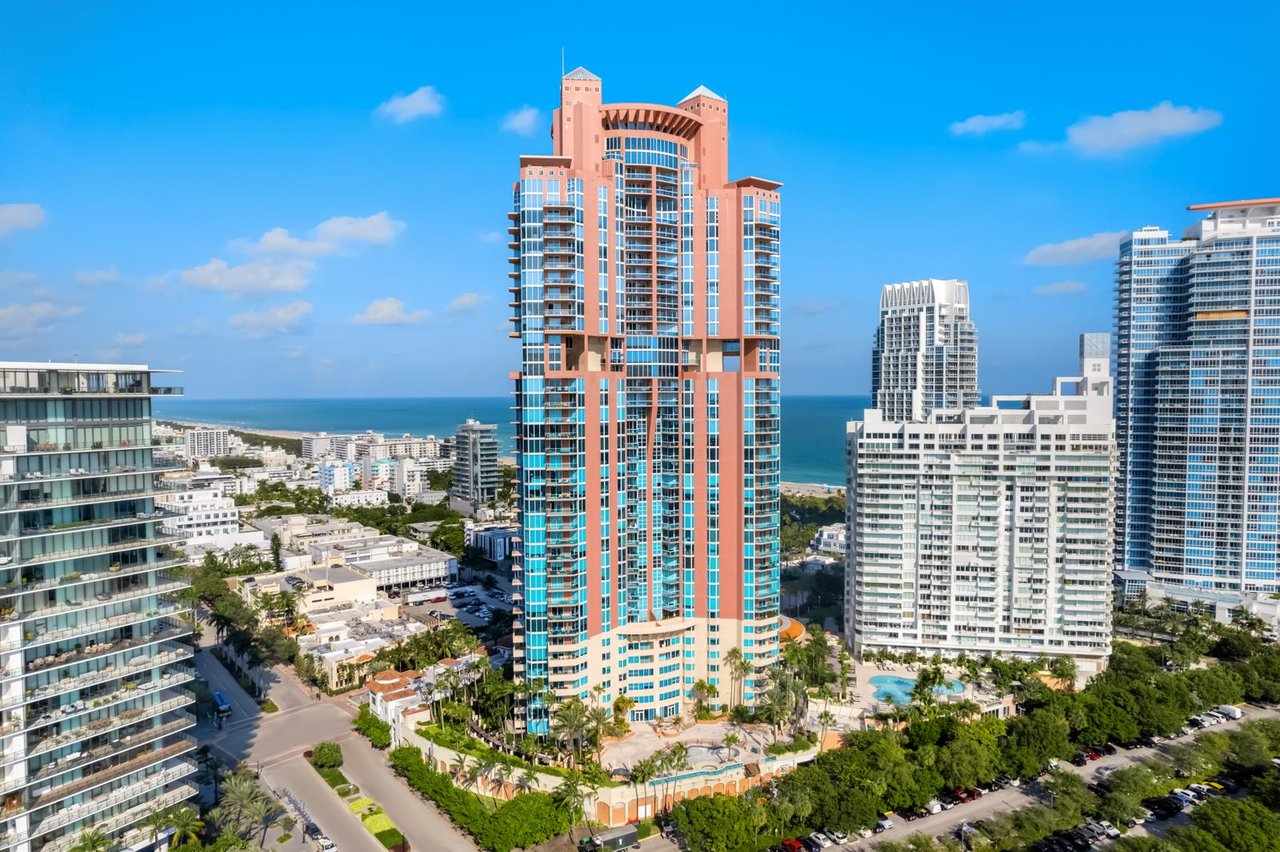
South Beach has a deeper and more diverse condo pool, from boutique Art Deco buildings to ultra-luxury high-rises on the ocean and the bay. Higher transaction counts create steadier month-to-month readings. Even here, results vary by building, amenities, and price band. Seasonal buyer flows influence the pace of sales and showing activity.
Cross-market factors
- Cash versus financing can change speed and leverage.
- New construction can inject sudden inventory, while resales move within a fixed supply.
- Insurance and coastal risk costs affect price elasticity at the high end.
The metrics that matter
Clear definitions make you confident and fast. Here are the core measures and how to use them.
Months of inventory
- Formula: MOI = Active Listings at month-end ÷ Average monthly sales over a trailing period.
- Guidance: About 6 months is roughly balanced. Less than 4 months is tight and more favorable to sellers. More than 6 months tilts to buyers.
- Tip: On the Venetian Islands, use 6 to 12 month rolling averages and always note sample size.
Absorption rate
- Formula: Absorption = Closed sales over a period ÷ Number of months in the period.
- Use: Track 3, 6, and 12 month absorption to filter out seasonal noise. A rising absorption rate and falling MOI often signal improving momentum.
Days on market and time to contract
- Days on market can be skewed by relists. Time to contract is a cleaner read when available.
- In luxury segments, expect longer marketing times than the broader market. Changes in trend matter more than absolute levels. A steady drop in days to contract is an early green flag.
List-to-sale price ratio
- Use this to gauge pricing power. Falling ratios and frequent reductions point to increasing buyer leverage.
Pendings versus new listings
- Rising pendings relative to new listings suggest demand is starting to outrun supply. If pendings fall while new listings rise, momentum is cooling.
Price-band splits
- Segment by bands, for example 1 to 2 million, 2 to 5 million, and 5 million and up. MOI can look balanced overall while the top tier softens, or the reverse. Always compare within the exact price band you care about.
Seasonality in Miami Beach
Seasonality is a real force here. Understanding the calendar improves your timing.
- Winter high season runs from roughly November through April. Buyer traffic, especially from out-of-area visitors, increases. Many contracts written in these months close in late winter and spring.
- Summer tends to be slower. From June through September, showings ease, listings can accumulate, and days on market may stretch.
- Transitional months like May, June, and October can spike as pricing and inventory reset.
On the Venetian Islands, small-sample effects can amplify these swings. A few winter closings can make MOI appear to drop sharply, so stick to rolling averages.
How to read today’s signals
You can translate data into action with a few simple checks. Tailor these to your building, island block, and price band.
Quick checks for sellers
- Track 6 to 12 month MOI in your exact building and band. If MOI rises above 6 and days on market trend up, consider pricing or presentation updates.
- Watch the mix of cash versus financed buyers. More financing can lengthen timelines and increase fall-through risk.
- Time your launch. Listing between November and February typically reaches the largest seasonal audience. If you list in summer, be sharper on pricing or plan for longer marketing.
Quick checks for buyers
- Compare pendings to new listings in the last 30 to 60 days. A growing pending backlog is a sign to move quickly on quality listings.
- Review recent price reductions in your building or block. Multiple reductions can signal room to negotiate.
- Evaluate MOI in your exact price band. If MOI is above 6, the odds of concessions improve.
Red flags and green flags
- Red flags: MOI climbs for several months, many reductions in the same building, and more contingency fall-throughs.
- Green flags: MOI falls for three or more months, pendings outpace new listings, list-to-sale ratios improve, and time to contract shortens.
Venetian Islands case context
Because condo volume on the Venetian Islands is limited, month-to-month stats can whipsaw. Use a 12 month rolling MOI and always call out sample size. If the trailing year shows fewer than 10 closed condo sales, treat any MOI reading as directional only. To validate a trend, look for the same pattern in nearby higher-volume sets like South Beach, the Sunset Islands, or Palm and Hibiscus.
For example, if your building’s rolling MOI falls for three months and South Beach’s comparable band also trends lower, that is a stronger signal than a single-month dip on the islands. Pair the data with qualitative inputs like showing feedback and open house traffic.
How to get building-level clarity
You can make better decisions with precise, building-level data. A trusted local advisor can pull MLS snapshots for active, pending, and closed listings, plus list-to-sale ratios and days to contract. Public records from Miami-Dade confirm historic sales and deed recordings. Combining these sources with price-band splits and a rolling window creates a clean, decision-ready view.
If you are a seller, ask for a presentation plan that fits seasonal timing and your buyer profile. If you are a buyer, request recent comparable sales within the same building or immediate island block to avoid distortion from one-off trophy closings.
Next steps
If you want a tailored read on the Venetian Islands or South Beach, focus on the metrics above and the calendar. Use rolling views, segment by price band, and compare island signals with a nearby higher-volume set to remove noise. From there, a curated marketing plan or acquisition strategy becomes much simpler.
Ready to see building-level numbers and a strategy that fits your goals? Connect with Adrian Burke for a private, data-smart plan that pairs neighborhood expertise with concierge service.
FAQs
What do past Miami condo cycles mean for Venetian Islands buyers?
- Past cycles show that supply waves, rates, and international demand shape timing. Use rolling MOI and price-band splits to separate noise from real trends before you bid.
How do you calculate months of inventory in Miami Beach?
- Divide active listings at month-end by the average monthly sales over a trailing period, then compare to the 6-month balanced benchmark for your exact price band.
Is winter always the best time to sell a luxury condo?
- Winter brings more buyer traffic and showings, but pricing, presentation, and buyer mix often matter more. Well-priced listings can perform outside peak months.
Are luxury condos sensitive to mortgage rates?
- Yes, especially for financed buyers. Ultra-high-end cash purchases can be less rate-sensitive, so watch the financed versus cash share in your target band.
What signals show momentum shifting in South Beach and on the islands?
- Look for MOI moving in one direction for several months, matching changes in days to contract and list-to-sale ratios, plus pendings rising or falling versus new listings.